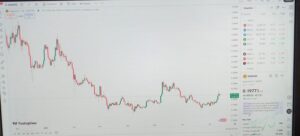
Advanced Candle Pattern Analyzer
Upload your candlestick chart to get BUY/SELL/WAIT signals based on candle psychology and technical confirmation
How It Works
- Upload your candlestick chart image (JPG/PNG)
- Tool scans for patterns (Engulfing, Doji, Hammer, etc.)
- Analyzes candle psychology and confirmation rules
- Provides BUY/SELL/WAIT signal with reasoning
Analysis Logic
- BUY: Bullish Engulfing + Support + Volume spike
- SELL: Bearish Engulfing/Shooting Star + Resistance
- WAIT: Doji + No confirmation or low volume
Advanced Candle Pattern Analyzer
- Upload a Chart: Drag and drop a candlestick chart image (JPG/PNG) or click to browse files.
- Analyze: Click the “Analyze Chart” button to process the image.
- View Results: The tool will display:
- Detected candlestick patterns
- Psychological analysis
- Confirmation rules
- Volume analysis
- Final signal (BUY/SELL/WAIT)
Implementation Notes
- This is a front-end only implementation. In a production environment, you would need:
- Backend server for actual image processing
- Machine learning model for pattern recognition
- More sophisticated analysis algorithms
- The current JavaScript simulates analysis with random results for demonstration purposes.
- For a complete solution, you would need to implement:
- Actual image processing to detect candle patterns
- Integration with technical indicators
- More sophisticated decision logic
- The UI is fully responsive and works on both mobile and desktop devices.

